Live From the Storm at CMS
Activity 3.5 Sizing up a Storm
|
Live From the Storm at CMS |
|
Activity 3.5 Sizing up a Storm |
Teacher Background
"The National Weather Service has just issued a severe thunderstorm warning for the following counties.........".
How often has your favorite TV program been interrupted with these familiar words? Whether you live in tornado alley or face the fury of tropical storms, you and your students are constantly reminded of the awesome forces of nature. Because of its geographic location and topography, the United States witnesses some of the most varied and violent weather of any country on Earth. What tools do meteorologists use to help give advance warnings of these impending storms? One such weapon in the arsenal of a storm tracker is Doppler radar.
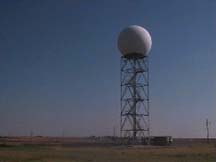
Radar has been used to track storms since the early 1940's. Following World War II, surplus military radar systems were employed to track storms over short distances. Unfortunately, this method gave too little advance warning to people in the paths of killer tornadoes and hurricanes. Long-range radar was eventually developed and became a useful tool for meteorologists. Today, WSR-88D ( Weather Surveillance Radar developed in 1988, Doppler ), uses different modes to locate and measure various properties of a storm. In the reflectivity mode, the radar indicates the location, movement and intensity of precipitation ( see Model 1 activity ). In the velocity ( Doppler ) mode, the radar determines the vorticity, or circulation within the storm ( see Model 2 activity ). All of these measurements are made by sending out short bursts of microwave energy and using a 10 meter diameter dish antenna to detect the echoes. The antenna is housed in a tall round structure called a radome.
A storm captured in a modern weather radar image is shown in various colors based on the mode, each representing a different storm value. In the reflectivity mode, colors run from light green, which represents light rain, to dark red, which represents heavy rain or hail . In the velocity ( Doppler ) mode, green represents movement of air toward the radar antenna and red represents movement away from the radar antenna.
The same principle which allows police to determine the speed of a passing motorist is used by meteorologists to locate areas of rotating air within a storm. It's this ability to discern internal air circulation that makes Doppler radar such a powerful weather monitoring tool. Meteorologists look for "signatures" inside the storm circulation. One such signature is a "J" hook shape appearing near the back side of the storm. It often means one thing - tornado.
Objectives
The students will create a model to simulate the tracking of a storm by modern weather radar
The students will use the model to distinguish between areas of storm intensity and internal air circulation
The students will use the model to predict the direction and movement of the storm system
Materials
* 1 shoe box with lid per team of students
* tape
* glue
* assorted materials of different hardness ( rocks, Styrofoam, cardboard, marshmallows, foam rubber, crumbled aluminum foil, Play-Doh, etc. )
* metal coat hangers, knitting needles, or wooden skewers
* an awl, leather punch or other sharp object to punch holes in the shoe box lid
* crayons or colored pencils
* Activity 3.5 black line master
Engage
Ask the students when they last recall having their TV viewing interrupted by severe weather announcements. During which seasons of the year are these watches and warnings most common? ( Severe storms can occur year-round, although tornado season in U.S. is typically spring through early summer ) Discuss the difference between a severe storm watch ( conditions are favorable for the storm to occur ) and a warning ( a severe storm has been sighted ).
What tools do meteorologists use to locate and track severe weather? ( Radar, satellite, weather balloons, trained storm spotters ) What can these tools tell us about the storm? ( size, type, and intensity of precipitation; Doppler radar can also locate rotation of a column of air inside of a storm ) Perhaps your students have seen weather radar images on a TV weather report or on the Internet. What do the different colors of the weather radar image represent? ( In the reflectivity mode they represent size, type, and intensity of precipitation. In the velocity mode they represent air movement toward or away from the radar pulse )
Procedure
Divide the class into teams of 2-3 students. Distribute a shoe box and lid, 2 copies of the black line grid pattern, and all other materials to each team. Inside each box the students will use the items of various hardness to create a severe storm representation. Decide whether to have the students attempt Model 1, Model 2, or both.
Model 1 - Reflectivity Mode
1. Different types and intensities of precipitation within a storm produce different echo patterns on weather radar. To represent this, the students should arrange the materials in their box with the hardest items ( e.g., rocks ) at the center of their model storms and the softest items ( e.g., marshmallows ) at the outer edges. It would work best to build the model storms out of materials representing four different degrees of hardness.
2. Since storms can line up along fronts, students should not limit their models to the center of the boxes. All of the materials should be secured to the bottom of the boxes. Once secured, the students should tape the lids on the shoe boxes and trade them with those built by other teams.
3. Tape or glue a copy of the grid pattern to the top of each box lid. Using an awl, leather punch, or other sharp object, have one student punch a hole in the center of each 1 cm x 1 cm square on the grid paper.
4. On the second grid pattern, the students should label directions north, south, east and west. They should also draw and label the locations of various cities in their county or region. You may wish to have a local map available for reference.
5. Beginning on the box lid at grid square (1,1) and continuing through (1,2), (1,3), etc, stick the probe ( made of a knitting needle, cooking skewer, or straight piece of coat hanger metal ) into each hole and lower until it either encounters part of the model storm or the bottom of the box. It would be helpful if they would make a reference mark on the probe, level with the lid of the box, when the probe is clearly touching the bottom.
5. Use the following number and color hardness key to represent radar echoes of various intensities within the model storm ( no echo - 0 - no color, softest material - 1 - green, firm - 2 - yellow, moderately hard - 3 - tan, hardest material - 4 - red ) As one student probes the "sky" surrounding and above the model storm and calls out the hardness number at each location, a teammate writes in the number in the corresponding squares on the second grid sheet.
6. After completing row 1, repeat the process for each of the other rows of squares on the grid sheet. Finally, shade in the squares on the second grid sheet with the appropriate colors corresponding to the numbers.
7. Upon completion of the simulation, each team should have a grid sheet showing the location of a storm and regions of various precipitation intensities.
8. Over or near which city is the storm occurring? What cities are in the path of the moving storm? Remember, large scale weather systems in the U.S generally travel from west to east.
9. Compare and contrast the student storm models to actual weather radar reflectivity mode images found on the Internet.
Model 2 - Velocity ( Doppler ) Mode
1. Create a simulated velocity (Doppler) image by using materials of only two types of hardness. Arrange the harder materials in a semi-circular pattern on one half of a circular area and the softer materials in a semi-circular pattern on the opposite half of the area. The center of the circular area would represent the radar source.
2. Use green to represent the softer materials ( hardness of 1 or 2 ) and use red to represent the harder materials ( hardness 3 or 4 ). IMPORTANT NOTE - Since we're simulating the velocity ( Doppler ) mode of weather radar, the colors in the resulting patterns have different meanings than used in the reflectivity mode. In the velocity ( Doppler ) mode, red represents air moving away from the radar source and green shows air flowing towards the radar source.
3.When both green and red appear side-by-side within a storm on the Doppler image, and on the same side of the radar source, this can suggest a rotating air column, a signature of a developing tornado. Compare and contrast the student radar models to Doppler radar images found on the Internet.
Expand/Adapt/Connect
If you have access to a color printer, download and print examples of weather radar images taken off the Internet. ( See URL list below ) Display these beside student model storms drawn on the grid sheets. Locate an Internet site which displays weather radar images near your community. These can often be found on local TV station web sites. Older students can research new technologies used in weather radar which display vertical and 3 dimensional images of storm systems.Technologically savvy students and teachers can attempt to render their storm models and radar simulations into computer images. Be sure to share your successes with the discuss-storm list. How do astronomers use the principle of the Doppler effect in their work? ( They use it as evidence of an expanding universe noting the red shift in the spectra of distant galaxies )
Suggested URL's
Weather Underground National Radar Page
DataStreme National Radar Page
USA Today - Understanding Weather Radar
USA Today - National Radar Page
Assorted Radar Images of Oklahoma City Tornado, May 3, 1999
Baron Services - Examples of new technologies in weather radar
Teacher Note - We often use models to make complex processes more understandable for our students. Yet, in every model there exists the potential for the students to draw an unintended conclusion. In our shoe box models, the probes were lowered into the simulated storms from the top down. In reality, Doppler radar scans both horizontally and vertically ( from the ground up and out ) thereby sweeping out a cone.
Also - Because many of the materials used to model the shoe box storms can dry and harden over time, it is best to plan this activity over two or three consecutive days, not separated by a weekend or school holiday.