|
Tools of the Atmospheric Scientist Lesson #2 - Vertical Cloud Radar |
|
|
|
Target Level - Middle School/Junior High
|
One of the most widely used tools in meteorology is weather radar. Multi-colored images of approaching storms can often be seen on TV weather reports. This type of radar is called NEXRAD, which stands for "next generation weather radar". It is also called Doppler radar since it can detect movement of particles within the storm (Fig. 1) While a useful tool in weather forecasting, NEXRAD is only capable of detecting the larger particles carried within storms such as rain drops and hail. A more sensitive type of radar is necessary to detect the tiny water droplets and ice crystals which comprise clouds, thereby allowing atmospheric scientists to accurately measure cloud thickness and height. One such type of radar used by ARM scientists is called the Millimeter Wave Cloud Radar or MMCR. |
 (Credit - Weather Underground) |
 (Credit - ARM) |
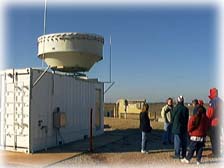
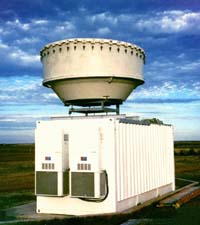
Unlike the more familiar NEXRAD
which projects a somewhat horizontal cone-shaped radar path,
the Millimeter Wave Cloud Radar transmits an upward signal
from the ground. This results in a vertical profile of any
cloud passing over the radar site. (Fig. 2). |
|
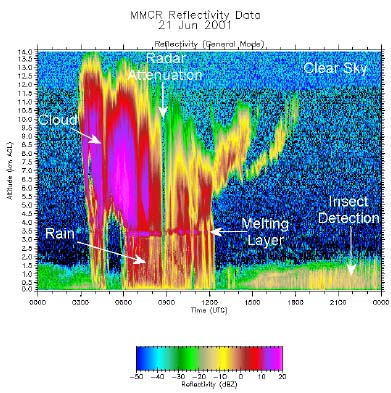
Two types of computer images can be rendered from MMCR data. In the "reflectivity" mode the largest particles encountered by the cloud radar produce the strongest reflection or echo. They can be seen as yellow to red to purple in Figure 3. |
 (Credit - ARM) Click on picture for larger view |
 (Credit - ARM) Click on picture for larger view |
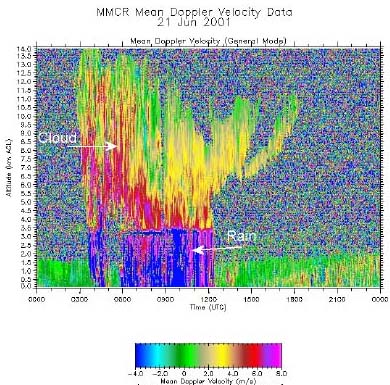
In the "velocity" mode the movement of particles toward or away from the radar source is also represented by different colors. Blue can be seen as movement of particles toward the radar source (falling rain) and red represents movement away from the radar source in Figure 4. This is the same principle used by astronomers to detect the movement and speed of distant galaxies. It is called the Doppler Effect. |
|
2. Go to the ARM Southern Great Plains data site for MMCR and open the 1/29/02 radar images for both velocity and reflectivity. 3. Using colored pencils, markers, or crayons, carefully color the cloud image shown in each picture on the blank sheets. Color in the reflectivity image on the reflectivity blank sheet and the velocity image on the velocity blank sheet. Avoid coloring the background in each image. 4. Open the larger view for each
radar example shown above. Attempt to match and label each
feature identified in the two samples with those your
1/29/02 radar images. |
|
Interpreting the
Data 2. At what altitude does the melting layer seem to appear in each image (km)? 3. Using the time scale along the bottom of each radar image (expressed in Universal or Zulu time) determine the time the cloud first appeared over the radar site. 4. At what time did it last appear over the radar site? 5. Determine how long it took the cloud to pass over the radar site. Congratulations! You have taken another step in understanding how meteorologists use atmospheric data to help monitor and forecast the weather. |
|
National Science Education Standards Annotated by MCREL (Standard - Level - Benchmark) Standard 1. Understands atmospheric processes and the water cycle: 1-III-1, 1-III-2, 1-III-4, 1-III-6 Standard 9. Understands the sources and properties of energy: 8-III-8, 8-III-9 Standard 11. Understands the nature of scientific knowledge: 11-III-2 Standard 12. Understands the nature of scientific inquiry: 12-III-1, 12-III-5, 12-III-6, 12-III-7 Standard 13. Understands the scientific enterprise: 13-III-3 |
Return to Tools of the Atmospheric Scientist