|
Tools of the Atmospheric Scientist Lesson #3 - Surface Meteorological Observation System (SMOS) |
|
|
|
Target Level - Middle School/Junior High
|
When we watch a weather report on television or listen to NOAA Weather Radio we most often hear about surface weather conditions. The reports describe such factors as temperature, heat index, windchill, air pressure, wind speed and direction, relative humidity, and measured precipitation. These measurements can also be found on conventional surface weather maps (Fig. 1)
|

(Credit - Datastreme) |
 (Credit - ARM) |
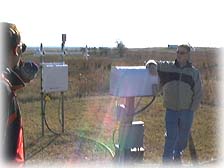
Atmospheric scientists at the various ARM sites collect surface data using weather instruments mounted on towers ranging in size from two to ten meters in height called the Surface Meteorological Observation System or SMOS (Fig. 2). Perhaps your school has a weather station mounted on the roof from which you can read and record local weather conditions. New designs in weather stations allow you to access weather conditions at other schools across the country via the Internet.
|
|
From the Southern Great Plains (SGP) ARM site, surface data can be accessed as 1-minute and 30-minute averages (Fig. 3) by going to the following link.
|

(Credit - ARM) |
|
|
|
1. Using your favorite weather reporting site on the Internet or your own school weather station, log the following local surface weather conditions for a minimum of 30 consecutive days. (temperature, heat index, windchill, air pressure, wind speed and direction, relative humidity, measured precipitation, and cloud cover). Attempt to record and log your data at approximately the same time each day. Be sure to note any significant or extreme weather changes which occur during the period of data collection. 2. Estimate cloud cover and record as a percentage (0, 25, 50, 75, or 100) 3. At the end of the 30 day period (or length of time determined by your teacher), construct a series of horizontal line graphs plotting each of the individual weather measurements. The vertical axis for each graph should represent the range of readings for each type of measurement, and the horizontal axis should represent the length of time in days (1-30, 1-60, etc.) 4. Plot cloud cover as a percentage (0, 25, 50, 75, or 100) 5. Up to four different types of weather measurements can be plotted on each graph as long as you use different colored lines and multiple vertical axes. 6. Attempt to keep the dimensions of all graphs the same size. 7. To compare the patterns of measurements plotted on two different graphs, place one graph on top of the other and hold them up to a light or window.
1. Compare and contrast the patterns of the graphed lines of each of the following weather factors: a. temperature vs heat index b. temperature vs wind chill c. temperature vs air pressure d. wind speed vs wind chill e. wind speed vs air pressure f. air pressure vs percentage of cloud cover g. measured precipitation vs relative humidity h. measured precipitation vs percentage of cloud cover i. measured precipitation vs air pressure 2. Suggest reasons for any observed relationships you determined between local weather factors. 3. Compare and contrast any observed relationships you determined between local weather factors with ARM SGP SMOS data. Congratulations! You have taken another step in understanding how meteorologists use atmospheric data to help monitor and forecast the weather. |
|
National Science Education Standards Annotated by MCREL (Standard - Level - Benchmark) Standard 1. Understands atmospheric processes and the water cycle: 1-III-1, 1-III-2, 1-III-3, 1-III-4, 1-III-5, 1-III-6 Standard 9. Understands the sources and properties of energy: 9-III-4, Standard 11. Understands the nature of scientific knowledge: 11-III-1, 11-III-2, 11-III-3 Standard 12. Understands the nature of scientific inquiry: 12-III-1, 12-III-3, 12-III-5, 12-III-6, 12-III-7, 12-III-8 Standard 13. Understands the scientific enterprise: 13-III-3 |
Return to Tools of the Atmospheric Scientist