|
Tools of the Atmospheric Scientist Lesson #5 - Measuring Water Vapor |
|
|
|
Target Level - Middle School/Junior High
|
Water can exist in the atmosphere in three different phases - solid, liquid, and gas. We observe water in the solid phase in the form of snow and in clouds composed of ice crystals. Rain falling from the sky and clouds made up of tiny water droplets represent the liquid phase of water (Fig. 1). However, much of the water suspended in the atmosphere is in the form of an invisible gas we call water vapor. |

(Credit - ARM) |
(Credit - ARM) |
A measure of the water vapor content of the air is called humidity. It is most often expressed as a ratio of the amount of water vapor present in a given volume (parcel) of air compared to the total amount of water vapor which that same unit of air could actually hold. This ratio we call relative humidity and it is always expressed as a percentage. When the relative humidity reaches 100%, the air has become saturated and water vapor will begin to condense into liquid water or ice crystals. Relative humidity can be measured with a hygrometer (Fig. 2) or a psychrometer. Hygrometers designed for home use are often found mounted together with two other weather instruments, a thermometer to measure room air temperature and a barometer to measure air pressure. |
|
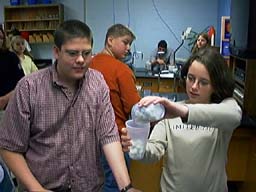
The human body responds to different levels of moisture in the air in various ways. When the amount of water vapor in the air is below the comfort range, your skin can feel dry and itchy. When it is above the comfort range, perspiration is slow to evaporate off your skin resulting in a sticky and sweaty feeling. The students in Fig. 3 are modeling the action of water vapor in the atmosphere. The Styrofoam packing peanuts represent water molecules. Various size plastic cups represent a parcel of air at different temperatures - the smaller the cup, the lower the air temperature. When they pour the Styrofoam peanuts into smaller cups, they are modeling a decrease in air temperature. Peanuts that can fit inside the cup represent water vapor. Peanuts that overflow when they attempt to fill a smaller cup represent water which has condensed into a liquid or formed ice crystals. What condition of the air is represented by a cup that is completely filled with Styrofoam peanuts? What is the relative humidity represented by a cup that is half filled with Styrofoam peanuts? What does this modeling activity suggest about the ability of air to hold water vapor at different temperatures? |
|
(Credit - ARM) |
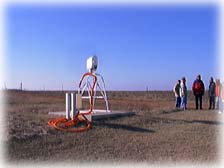
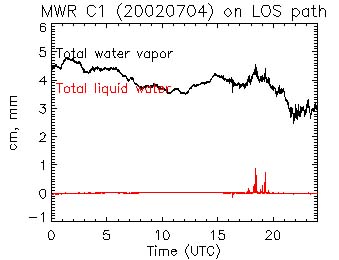
Because water vapor is considered a primary greenhouse gas, scientists continually monitor the amount of both water vapor and suspended liquid water in the atmosphere. The instrument which ARM scientists use to make these measurements is called the Microwave Water Radiometer or MWR (Fig. 4). Scientists use the MWR to calculate the total amount of water vapor and the total amount of liquid water in a vertical column of the atmosphere directly above the instrument. The liquid water measured by the MWR is in the form of tiny suspended droplets which can comprise clouds. However, the MWR is not designed to measure larger size rain drops. These can overwhelm the sensitivity of the instrument and produce occasional "spikes" in the data.
|
|
Data collected from the MWR is shown in Fig. 5. The black line represents total water vapor measured in millimeters and the red line represents liquid water measured in centimeters. The time scale at the bottom of the graph is shown in Universal Coordinated Time (UTC), which is six hours ahead of SGP local time during standard time and five hours ahead during daylight savings time. |
(Credit - ARM) |
|
|
|
1. Go to the ARM SGP MWR site and select the data plot for yesterday. 2. Observe the total water vapor/total liquid water data plot. 3. Ignoring occasional spikes in the graph, what was the highest level of total water vapor measured (mm)? 4. Ignoring occasional spikes in the graph, what was the highest level of total liquid water measured (cm)?
1. Return to the ARM SGP MWR site and select five dates from any of the following months - December, January, or February. 2. Determine and record the highest total water vapor measurements for each date selected. 3. Using the ARM SGP MWR site, select five dates from any of the following months - June, July, or August. 4. Determine and record the highest total water vapor measurements for each date selected. 5. Based on the data you recorded, what effect does air temperature have on the amount of water vapor which the atmosphere can hold? Extension - 1. Go to the ARM SGP MMCR site and find several dates on which heavy cloud cover can be observed in the MMCR radar image. Find the MWR data plots for the same dates. 2. Return to the ARM SGP MMCR site and find several dates on which an absence of clouds can be observed in the MMCR radar image. Find the MWR data plots for the same dates. 3. Does cloud cover appear to have any effect on the total liquid water recorded by the MWR instrument? Explain. Congratulations! You have taken another step in understanding how meteorologists use atmospheric data to help monitor and forecast the weather. |
|
National Science Education Standards Annotated by MCREL (Standard -
Level - Benchmark)
Standard 11. Understands the nature of scientific knowledge: 11-III-1, 11-III-2, 11-III-3 Standard 12. Understands the nature of scientific inquiry: 12-III-1, 12-III-3, 12-III-5, 12-III-6, 12-III-7, 12-III-8 Standard 13. Understands the scientific enterprise: 13-III-3 |
Return to Tools of the Atmospheric Scientist