When we talk about temperatures, or measurements of any kind, we can discuss them in different terms. We can discuss daily, weekly, monthly, yearly, or even longer, statistics.
Range - the difference between the high and low temperatures
(Tmax - Tmin)
Mean - an average of the high and low temperatures.
These statistics are good for a single site, e.g.,
Charleston,
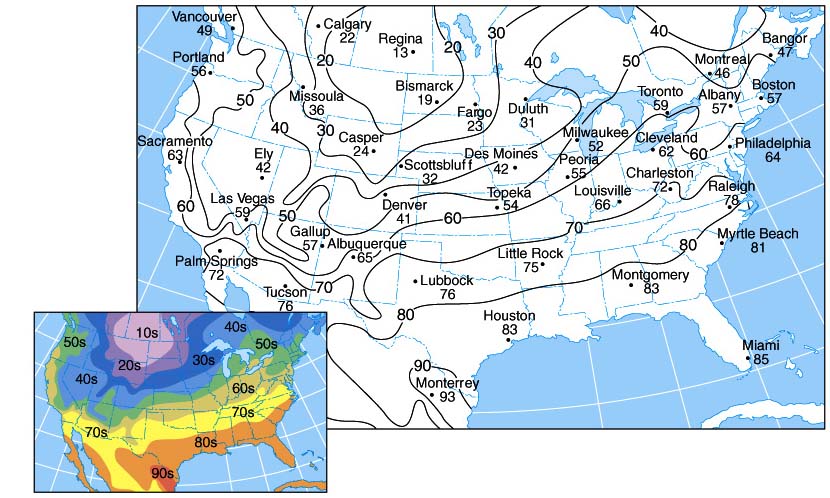
but in order to look at a region, or the country, we need to contour
the
temperatures into an isothermal map. An isotherm
is
a line along which the temperature is constant.
An isothermal map is useful since it shows us where temperatures are similar and where they are different. This is the type of map that we think about when we think about temperatures across the United States from the nightly weather report or the back of USA Today.
So, we know what temperature is, how it is measured,
the
units of temperature, and some methods in which it is averaged.
What controls temperature?
Remember, we already talked about three orbital factors that influence the amount of radiation the Earth receives from the Sun (eccentricity, obliquity, and precession).
On the Earth, there are several factors that help to control temperatures:


A Map of the major ocean currents of the
world.
Cold oceanic currents are blue, whereas warm currents are red.
Note,
along the United States'
west coast, the California Current is a cold current
flowing south. Along the east coast flows the northerly flowing
warm
Gulf Stream current.
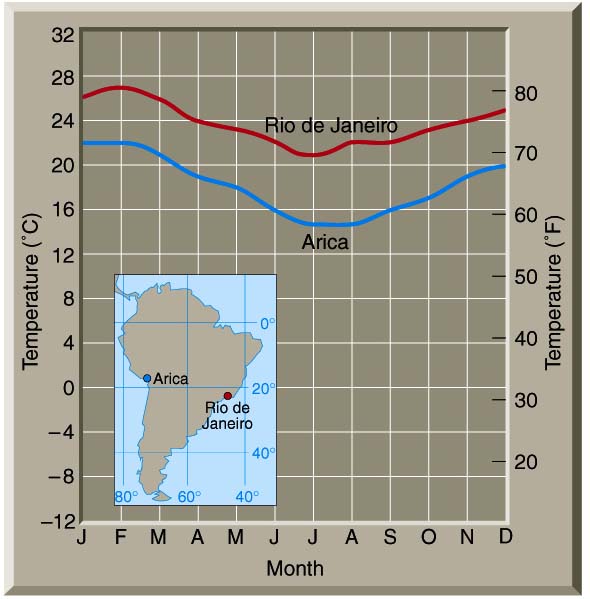
Figure 3-8 from Lutgens and Tarbuck's The Atmosphere, 8th
edition
Along South America's west coast, the cold Peruvian
Current
keeps temperatures in Arica cooler than temperatures
along the east coast of South America along which flows
the warm Brazilian Current.
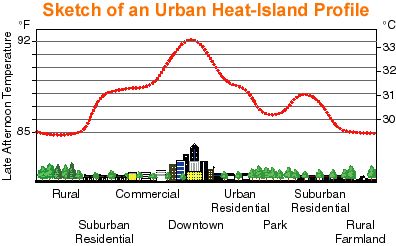
Heat Islands
As many city residents can tell you, cities can be very
hot places during the summer. On warm summer days, the air in a
city
can be 6-8°F hotter than its surrounding areas. Scientists
call
these cities "Urban Heat Islands." What causes this to happen?
Chicago's Urban Heat Island Initiative is demonstrating ways to mitigate these results. For instance, buildings absorb less heat if their roofs have reflective surfaces or green space. When these techniques are concentrated they can have a greater impact. Planting trees and other plants in parking lots and along major streets also helps cool an area.
Rooftop Gardens
DOE is especially interested in testing the heat
reducing
benefits of rooftop gardens. Not only does the technique promise
reduced
energy demand for a building, and lower temperatures in an area, it is
attractive.
The Department of Environment created its Rooftop Gardening Initiative to demonstrate practical techniques through projects in four communities and downtown. The projects will demonstrate different garden designs and different kinds of plants that can be used, in addition to working through a variety of construction challenges for different types of roofs.
The City will take advantage of opportunities afforded in different parts of Chicago, such as greening roofs along elevated train tracks where CTA riders can see and enjoy them. DOE is working with the US EPA and US Department of Energy to measure the benefits of these efforts to reduce urban heat islands.
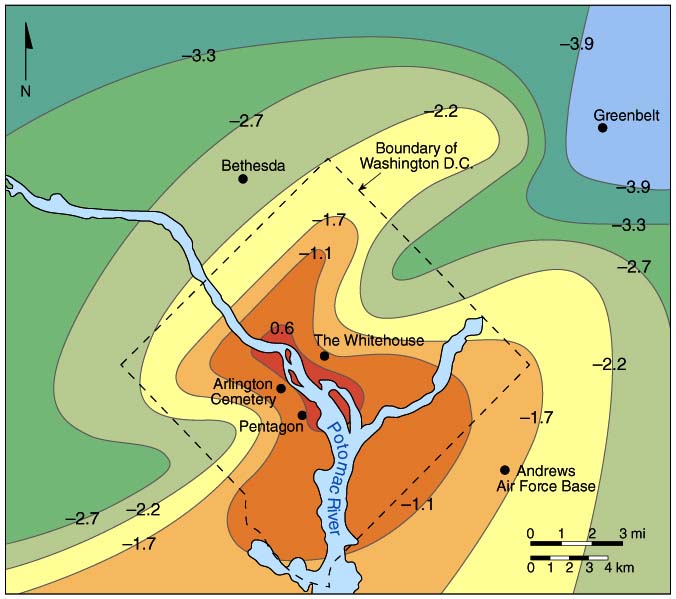
The heat island of Washington, D.C. shown as an isothermal map.
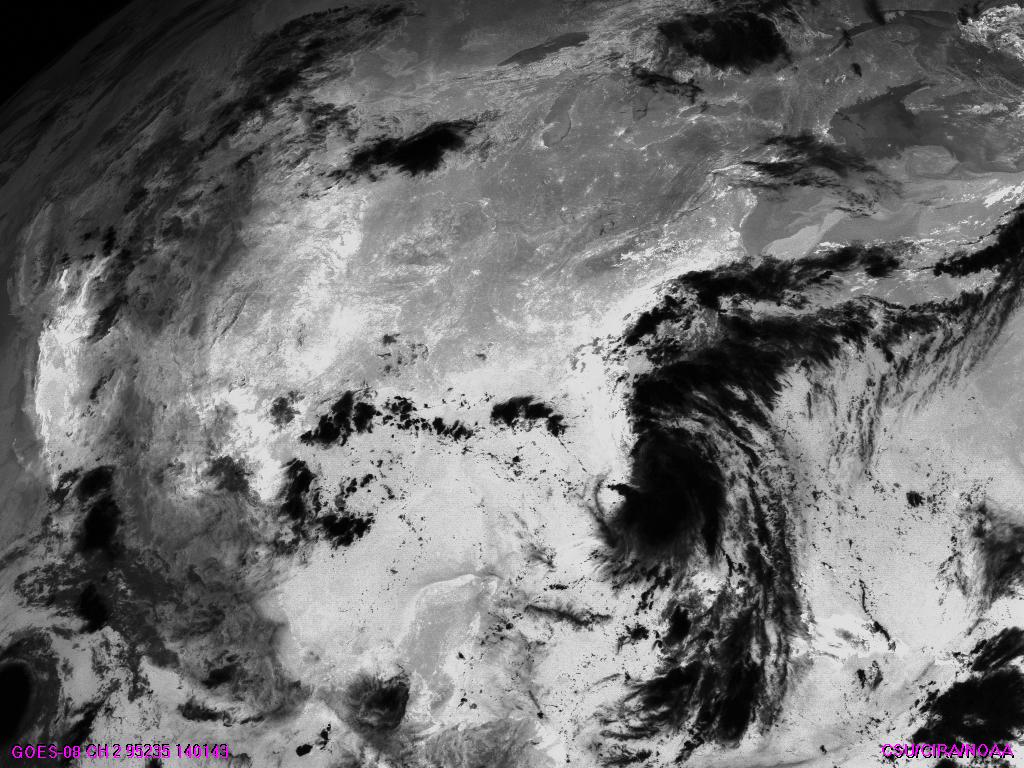
GOES-8 Channel 2 August 23, 1995 1401 UTC
The ability to locate urban heat islands under clear
sky
conditions during late night or early morning hours can be seen in
enhanced
3.9 mm images from GOES-8 and GOES-9.
There is a variability in land surface temperatures on scale of
fractions
of a kilometer around cities and their suburbs. The short-wave
channel
has a stronger response to warm areas as well as detecting more energy
from within one field of view.
The figure above is an enhanced short-wave image from
GOES-8 satellite covering the Northeastern United States. The
dark
areas are cold clouds, while the bright areas are warm surface
areas.
The cities appear as bright blemishes. Can you identify Chicago
in
the image?
In September of 1999, Chicago Mayor Richard Daley planted the first of 20,000 plants in a rooftop garden at City Hall. The city is building the garden to test the effectiveness of the foliage in heat island and air pollution reduction."This garden will be both beautiful and functional," Daley said at the time of the planting. "More than that, it will help cool the building in the summer because we'll no longer have a dark roof absorbing the sun's rays and raising the building temperature. That means the city will use less energy for air conditioning, saving the taxpayers some money and cutting down on the pollution."
The garden will contain more than 150 varieties of plants and will cover half of the roof. With the U.S. Environmental Protection Agency and the Department of Energy, the city will measure the project's effect on energy use within City Hall and on surrounding air temperatures.
Two more rooftop gardens are in the works in Chicago. The city will be planting atop the Midwest Center for Green Technology and the Peggy Notebaert Nature Museum. In addition to having the gardens, those sites will include solar panels, which the city will test for effects on energy use and heat island mitigation.
Data will be gathered from the sites continually, and Chicago expects to finalize results of its heat island initiatives in several years. For more information on the projects, contact the city's Department of Environment at (312) 744-5716.