|
Tools of the Atmospheric Scientist Lesson #4 - Measuring Solar Radiation |
|
|
|
Target Level - Middle School/Junior High
|
The driving force behind all of our weather on Earth is the sun. The uneven heating of the Earth's surface by the sun contributes to the formation of different air masses and influences ocean currents. This continuous dance of the sea and the sky governs our weather and climate (Fig. 1). |
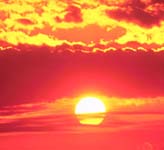 Fig. 1 - The Sun (Credit - NOAA) |
 (Credit - Steve Ackerman and Tom Whittaker) Click on image to view full size |
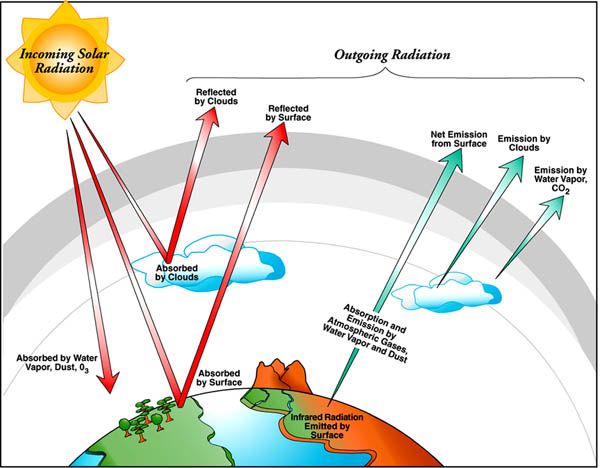
Energy from the sun reaches the Earth-atmosphere system in the form of electromagnetic radiation. However, only about half of the solar radiation makes it to the Earth's surface. The rest is either absorbed or reflected by clouds and the atmosphere. The Earth's surface itself can emit infrared radiation. The balance between incoming and outgoing radiation is called the Earth Radiation Budget (Fig. 2).
|
|
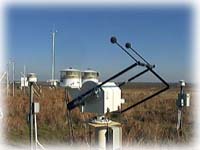
ARM scientists use radiometers (instruments for measuring radiant energy) to continuously monitor this balance between incoming and outgoing radiation. Various types of radiometers comprise the Solar Infrared Radiation Station or SIRS (Fig. 3). |
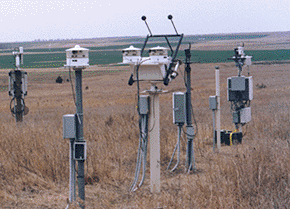
(Credit - ARM) |
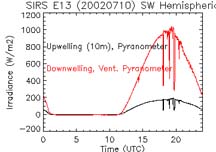 |
In the SIRS generated data plot (Fig. 4), the red line represents radiation directed towards the Earth's surface (downwelling) and the black line represents radiation directed upward from the Earth's surface(upwelling). |
|
(Credit - ARM) |
|
|
Activity - Measuring
Solar Radiation |
|
1. Go to the ARM SGP SIRS site and select the data plot for yesterday. 2. Observe the SW Hemispheric data plot. 3. The time scale at the bottom of the graph is shown in Universal Coordinated Time (UTC), which is six hours ahead of SGP local time during standard time and five hours ahead during daylight savings time. 4. The vertical axis represents irradiance - the flow of energy over a given area expressed as watts per square meter.
1. Between what hours (UTC) was the red (downwelling) line above zero W/m2? 2. Between what hours (UTC) was the red (downwelling) line at zero W/m2? 3. Convert the UTC time to the SGP local time. Based on SGP local time, why would the red (downwelling) line read zero W/m2 during the recorded time period? 4. What was the highest W/m2 reading recorded for the red (downwelling) line? 5. Return to the ARM SGP SIRS site. Select several days in June of any year. Calculate the average peak irradiance recorded on those dates. 6. Select several days in December of any year. Calculate the average peak irradiance recorded on those dates. 7. How do the averages compare between those recorded in June and those recorded in December? Suggest reasons for any apparent differences. Extension - 1. Go to the ARM SGP MMCR site and find several dates on which heavy cloud cover can be observed in the MMCR radar image. Find the SIRS data plots for the same dates. 2. Return to the ARM SGP MMCR site and find several dates on which an absence of clouds can be observed in the MMCR radar image. Find the SIRS data plots for the same dates. 3. Does cloud cover appear to have any effect on the irradiance recored by the SIRS instruments? What other factors could influence these results? Congratulations! You have taken another step in understanding how meteorologists use atmospheric data to help monitor and forecast the weather. |
|
National Science Education Standards Annotated by MCREL (Standard -
Level - Benchmark)
Standard 9. Understands the sources and properties of energy: 9-III-1, 9-III-3, 9-III-4, 9-III-8. 9-III-9 Standard 11. Understands the nature of scientific knowledge: 11-III-1, 11-III-2, 11-III-3 Standard 12. Understands the nature of scientific inquiry: 12-III-1, 12-III-3, 12-III-5, 12-III-6, 12-III-7, 12-III-8 Standard 13. Understands the scientific enterprise: 13-III-3 |
Return to Tools of the Atmospheric Scientist