 |
Tools of the Atmospheric Scientist Lesson #1 - Weather Balloons |
|
|
|
Target Level - Middle School/Junior High
|
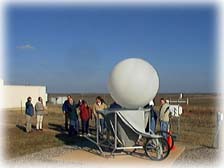
The temperature, air pressure, humidity, and wind directions in the upper levels of the atmosphere can directly influence the weather we experience near the surface. Therefore it is important that we continuously monitor these conditions. One way to do this is through the use of a weather balloon and transmitter called the Balloon-Borne Sounding System or BBSS (Fig. 1). |
|
 (Credit - Vaisala) |
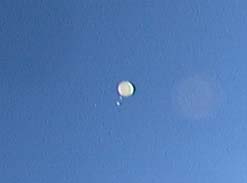
Weather balloons are filled with helium gas and released twice each day (00Z and 1200Z) from numerous sites. A small light-weight device called a radiosonde is attached to the bottom of the balloon. As the balloon ascends it measures and transmits air pressure, temperature, relative humidity, and can help determine wind speed and wind direction. From this information scientists can also derive dew point, latitude and longitude of the balloon, and other components of wind (Fig. 2). As the balloon climbs it
encounters lower air pressure which causes it to expand to
many times its original size. Eventually the balloon bursts
and the radiosonde falls back to the surface. |
|
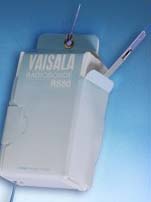
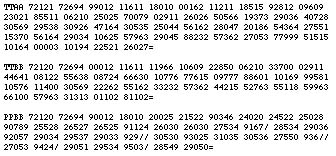
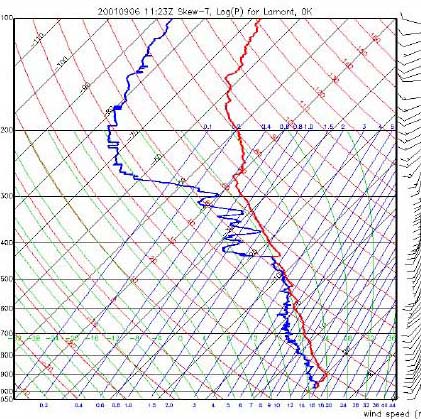
When the data is received from the radiosonde transmitter, it arrives as a series of numbers (Fig. 3). Scientists use computers to display the data in a picture form called a Skew-T diagram (Fig. 4). A Skew-T diagram is a type of
graph which displays various atmospheric conditions
encountered by the balloon and transmitter as they ascend
into the upper levels of the atmosphere. The name Skew-T
stands for skewed temperature since the isotherms at 10
degree intervals are curved or "skewed" to the right rather
than being perfectly vertical. |
 |
(Credit - ARM) |
Reading the Skew-T diagram 1. The left vertical axis shows air pressure. The highest pressure is near the surface and decreases with a rise in altitude from 1050 mb to 100 mb. This would represent nearly a 50,000 ft ascension of the balloon! 2. The barbs along the right vertical axis represent wind speed and direction at various altitudes. 3. The red line represents dry air temperature encountered by the rising balloon. 4. The blue line represents the dew point encountered by the rising balloon.
|
|
Activity - Comparing
Skew-T's to Surface Weather Conditions |
|
|
1. Go to the Skew-T Point and Click map and select six locations from across the U.S. (Credit - Ohio State University) 2. Print six b/w blank Skew-T diagrams (PDF) Note to teachers - If you divide the students into teams for this activity, fewer blank Skew-T copies will be necessary. (Credit - University of California, San Diego) 3. Using red and blue colored crayons or markers, carefully draw the approximate path of the temperature and dew point lines for each location on the blank Skew-T diagrams. You may wish to draw each line first in pencil and then trace over in crayon or marker. 4. Label the date, time, and location from which the Skew-T data was collected on each diagram. 5. Go to the current surface station weather map and find the surface reporting station closest to each of the cities you selected for the Skew-T diagrams. (Credit - Datastreme) 6. Describe the current weather conditions for each location along the bottom of each Skew-T diagram.
2. Describe the patterns of the blue dew point line and the red dry air temperature line on Skew-T's collected in regions of cloudy skies. 3. Describe the patterns of the blue dew point line and the red dry air temperature line on Skew-T's collected in regions experiencing precipitation and/or stormy conditions. 4. Summary - How do the patterns of recorded dry air temperature and dew point on a Skew-T diagram indicate the presence of a) clouds b) precipitation, and why? 5. Go to the Build A Cloud activity and apply what you've discovered to build as tall of a storm cloud as possible. Build A Cloud works best using Internet Explorer. (Credit - Steve Ackerman and Tom Whittaker) Congratulations! You have taken the first steps in understanding how meteorologists use atmospheric data to help monitor and forecast the weather. Classroom Lesson Video - 2.4 M Quicktime Making a Cloud Lesson Video - 2.2 M Quicktime
Annotated by MCREL (Standard -
Level - Benchmark)
Standard 11. Understands the nature of scientific knowledge: 11-3-2 Standard 12. Understands the nature of scientific inquiry: 12-3-1, 12-3-5, 12-3-6, 12-3-7 Standard 13. Understands the scientific enterprise: 13-3-3 |
 (Photo credit - Dr. Bill Rose Michigan Technological University) |
Return to Tools of the Atmospheric Scientist